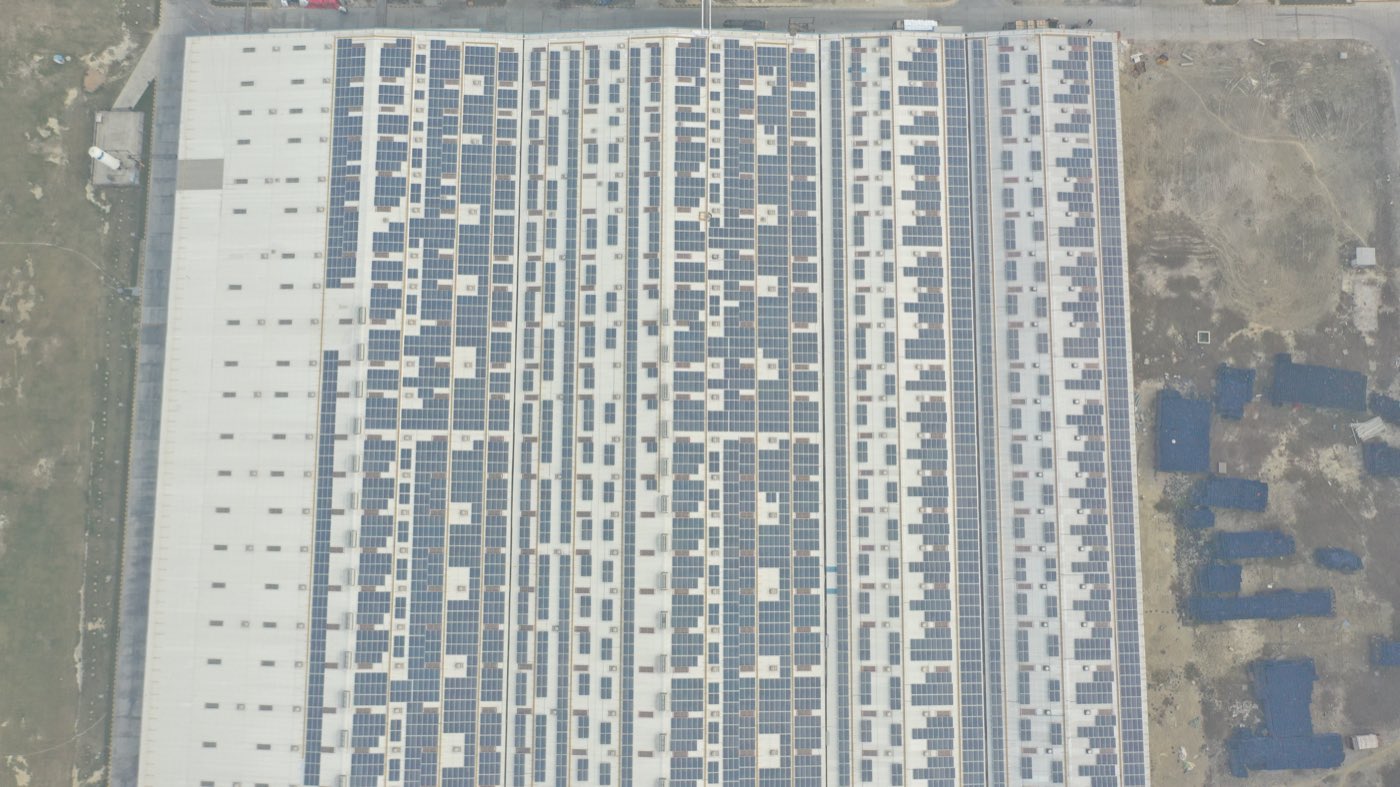
You either buy the plant — or just buy the power.
Four routes, structured to your balance sheet. Discovery starts with twelve months of electricity bills, and our engineering team sizes the answer from your actual load.
You either buy the plant — or just buy the power.
You own the asset
- Payback typically 3–4 years
- Accelerated depreciation benefit
- Financing arranged — typically 70:30 debt:equity
- Subsidy assistance — MNRE, IGL, CREST and state schemes
- Net metering for surplus, where the state allows
You buy the power
- Zero capital investment, zero operating risk
- Typically 10–15% below your grid rate
- Tariff fixed 15–25 years, non-escalating
- We own, insure and maintain the plant end to end
- Plant transferred to you after the minimum term
Own it, fund it over time
- Low equity requirement — you fund the equity share
- Project financing arranged alongside the build
- Savings designed to service the repayments
- You keep ownership, depreciation and the full saving
- Structured to your balance sheet and banking relationships
Beyond the roofline
- For loads your site alone cannot serve
- Power wheeled from our own solar parks
- No roof required — savings at scale
- Bilateral PPA; banking per state rules
- Group captive structuring where 26% equity applies
How the power and the money move.
For loads too large for your roof, we build the plant elsewhere and wheel the power to you over the state network.
Generate
Our solar park generates and injects into the network at 33 kV or 66 kV, depending on the substation the connection is granted at.
Wheel
The grid wheels power to your facility. Transmission and wheeling charges apply per state regulation, and we handle the DISCOM interface.
Save
Net units offset your DISCOM bill; surplus is banked and drawn back per state rules.
Open access is a state-regulated route. Eligibility, the charge structure and banking rules vary by state and are confirmed against the applicable SERC order before we quote.

Banking is being withdrawn. A battery is what replaces it.
Midday surplus held back and released into the evening peak — the service the grid used to provide for free. Our first co-located BESS, 7.5 MWh at 33 kV, is in commissioning at Chamu.
Where the battery sits in the system.
A battery energy storage system — BESS, in the way lenders and EPC contracts write it — is four boxes and a set of rules about when each one runs. This is a behind-the-meter configuration — array, conversion, battery and distribution, all on your side of the meter, serving your loads directly.
The array serves the facility directly. Whatever the site cannot absorb charges the battery rather than being exported at a price you did not set.
Generation falls away while the load does not. The battery discharges through the same inverter, displacing the most expensive block of the day.
Not the roof. The shape of your load curve against the generation curve, and how much of the gap between them is worth storing rather than buying.
Why a battery is not an accessory.
Solar arrives at midday. Your plant runs into the evening. Banking used to bridge that gap for free — and states are withdrawing it. Move the sliders and watch what a battery actually buys you.
A day in megawatts
An illustrative clear-day profile on a flat load, sized to show the shape of the problem rather than to size your plant. Real dispatch is modelled against twelve months of your actual interval data, your state's banking and settlement rules, and the tariff structure you are billed on. These figures are illustrative. Actual sizing, savings and payback depend on a detailed site and tariff analysis by Vibgyor’s engineering and commercial teams.
How your bill actually gets settled.
Three settlement regimes apply across Indian states. Which one you fall under changes the value of every unit you generate — and it is the single biggest driver of how we size your array.
Net metering
Units exported to the grid are set off one-for-one against units imported, and you are billed only on the net.
Net billing
− (EXPORT × SOLAR TARIFF)
Imports are charged at your normal grid tariff; exports are credited at a separate, lower solar tariff set by the regulator. Surplus is worth less than self-consumed generation.
Gross metering
− (SOLAR UNITS × SOLAR TARIFF)
The entire solar output is sold to the DISCOM at a notified tariff and your whole consumption is billed normally. The two settle against each other.
This is why we size the array against twelve months of your actual consumption profile rather than your roof area — under net billing and gross metering, an exported unit is worth materially less than one you use yourself. Which regime applies is set by your state's regulation and your sanctioned load.
Every plant, visible in real time.
Each plant streams to a monitoring portal — for our O&M team, and for you.
Live plant data
- Solar power (kW); day, month and total generation (MWh)
- Capacity utilisation factor (%)
- Irradiance (W/m²) and insolation (kWh/m²/day)
- Performance ratio — day and month (%)
- Ambient and module temperature (°C)
Grid & source data
- Total and daily import and export (MWh)
- Voltage, current, power factor and frequency
- Active and apparent power
- Combined load — solar plus grid source
- Inverter-, SMB- and string-level readings
What you get, monthly
- Generation and savings statement, benchmarked against design
- Actual against expected at DC and AC capacity
- Warranty and insurance status
- Net-metering or open-access settlement
- Monthly CO₂ report
The asset's performance is auditable rather than anecdotal — response time, plant availability and performance ratio are written into the O&M agreement, not offered on a best-effort basis.
Take the twenty-question checklist with you. Printable, one page per section, and nothing in it is specific to Vibgyor — run it against us too.
Send us twelve months of bills.
Send twelve months of bills and we will come back with all three structures priced against your balance sheet — including the storage case: our first co-located battery is in build at Chamu, and every plant we deliver is engineered storage-ready. The analysis comes back free, with no commitment.